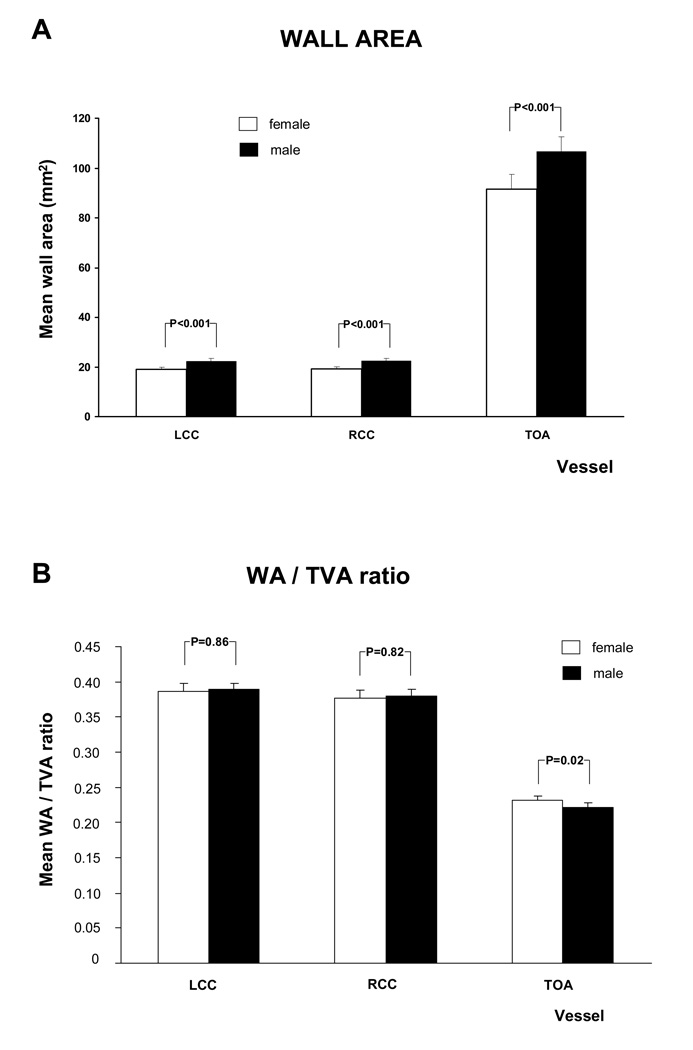
Figure 6. MRI - Parameters as function of gender and vessel.
This figure shows the relation between gender and mean wall area and WT /TVA ratio, after adjustment for age. Similar graphs were seen for the other MRI parameters (see A.3). There was a trend to greater values in males than in females, except for the WA / TVA ratio.

