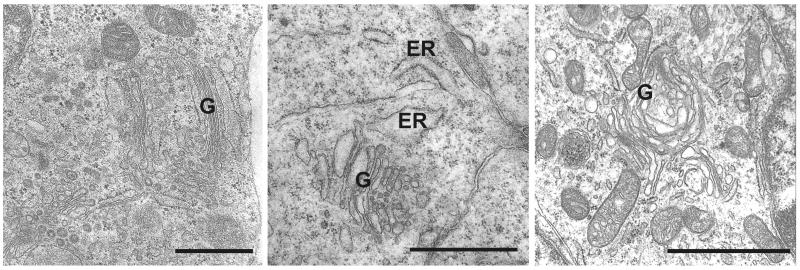
Fig. 1.
Golgi stress and Golgi stress responses in SPCA1-null embryos. Ultrastructural analysis revealed occasional examples of Golgi (G) with well-formed flattened stacks (left), but the number of cisternae were significantly reduced and the total amount of Golgi membranes and associated vesicles were significantly expanded (see morphometry in Ref. 11). Dilation of Golgi membranes (middle and right) was commonly observed and dilated rough ER (middle) was also observed. Dilation of Golgi and ER are indicators of Golgi and ER stress, and expansion of the Golgi is an apparent stress response favoring adaptation and survival (11). Bar = 1 micrometer

