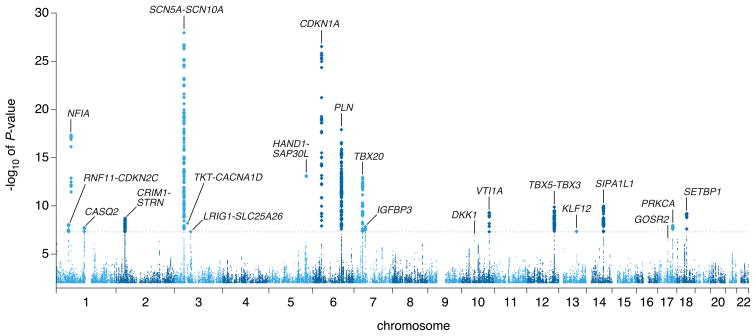
Figure 1. Manhattan plot.
Manhattan plot showing the association of SNPs with QRS interval duration in a GWAS of 40,407 individuals. The dashed horizontal line marks the threshold for genome-wide significance (P = 5 × 10⁻⁸). Twenty loci (labeled) reached genome-wide significance. Two additional loci, GOSR2 and DKK1, reached significance after genotyping of select SNPs in an additional sample of 7170 individuals (see Results).

