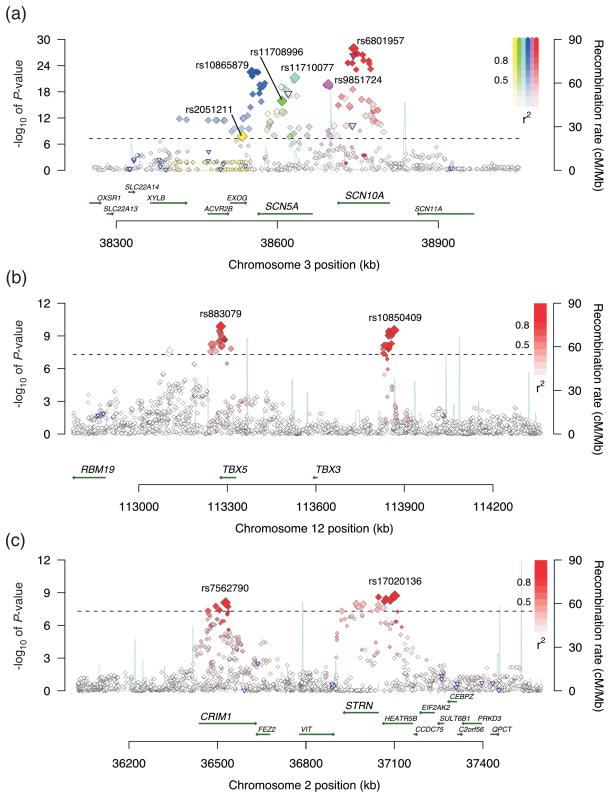
Figure 2. Association plots for select loci.
Each SNP is plotted with respect to its chromosomal location (x-axis) and its P-value (y-axis on the left). The tall blue spikes indicate the recombination rate (y-axis on the right) at that region of the chromosome. The blue-outlined triangles indicate coding region SNPs. (a) Locus 1 (SCN5A/SCN10A) on chromosome 3: The six index signals are named with their rs numbers and highlighted in different colors (yellow, green, teal, blue, purple, and red). Other SNPs in linkage disequilibrium with the index SNP are denoted in the same color. Color saturation indicates the degree of correlation with the index SNP. (b) Locus 8 (TBX5) and locus 9 (TBX3) on chromosome 12. (c) Locus 12 (HEATR5B/STRN) and locus 14 (CRIM1) on chromosome 2.

