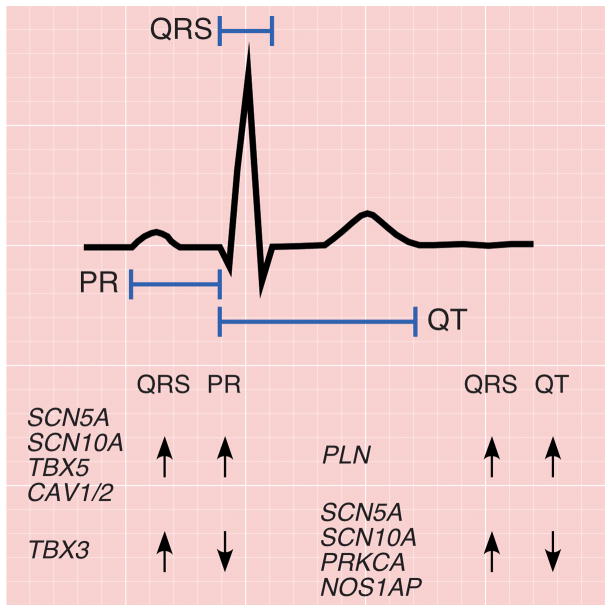
Figure 3. Pleiotropic associations of PR, QRS, and QT loci.
Electrocardiographic tracing delineating the PR, QRS, and QT intervals. PR and QRS intervals reflect myocardial depolarization and conduction time through the atria and down the atrioventricular node (PR) and throughout the ventricle (QRS), and are weakly positively correlated (r=0.09). The majority of loci that influence both PR and QRS (SCN5A, SCN10A, TBX5, CAV1/2), do so in a concordant fashion (i.e. variants that prolong PR also prolong QRS duration). The notable exception is a region on chromosome 12, where variants in the TBX5 locus have a concordant effect whereas those in nearby TBX3 have a discordant effect. By contrast, although QRS (ventricular depolarization) and QT (ventricular repolarization) are moderately positively correlated, the majority of loci (SCN5A, SCN10A, PRKCA, NOS1AP) that influence both phenotypes do so in a discordant fashion (i.e. variants that prolong QRS shorten the QT interval). The exception is the locus at PLN, where variants have a concordant effect.

