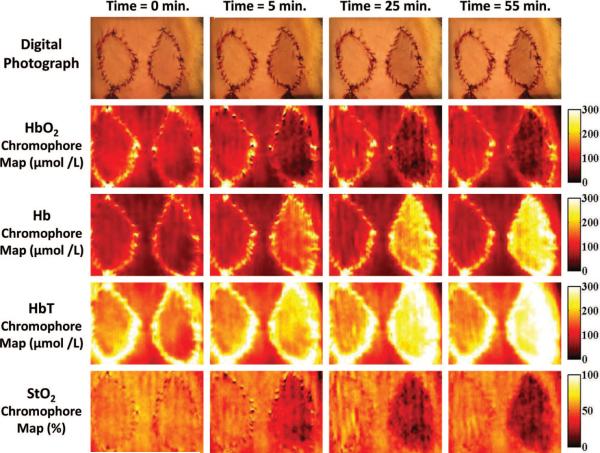
Fig. 2.
Sample of digital photograph and the corresponding chromophore maps as generated by the Tissue OxImager for all four chromophores parameters (oxyhemoglobin, deoxyhemoglobin, total hemoglobin, and tissue saturation). The flap on the left of each image represents a control flap, whereas the flap on the right is an experimental flap that underwent selective venous occlusion. The images at time 0 were obtained just before selective venous occlusion to the flap on the right side. Note the similar appearance between the control flap and the experimental flap at this time. The photographs and chromophore maps at time 5, 25, and 55 minutes illustrate the changes over time after selective venous occlusion of the flap on the right of each image. Note how the Tissue OxImager detects changes in oxyhemoglobin, deoxyhemoglobin, total hemoglobin, and tissue saturation by 5 minutes after selective venous occlusion, whereas the clinical appearance of the flap as illustrated by digital photography is only subtly different in appearance even after 55 minutes.

