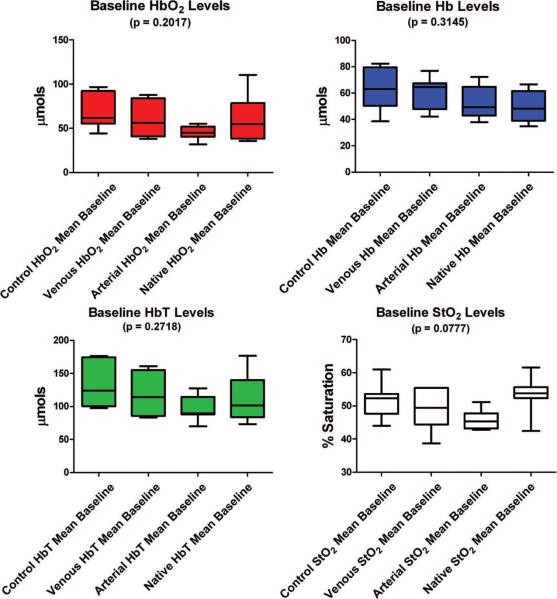
Fig. 3.
Comparison of measured chromophore values among all four groups (control flaps, selective venous occlusion flaps, selective arterial occlusion flaps, and native skin) during the baseline measurement period from −10 minutes to 0 minutes. The mean values are depicted as the center line and the error bars represent the range. The confidence interval of 2.5 to 97.5 percent is depicted by the colored boxes.

