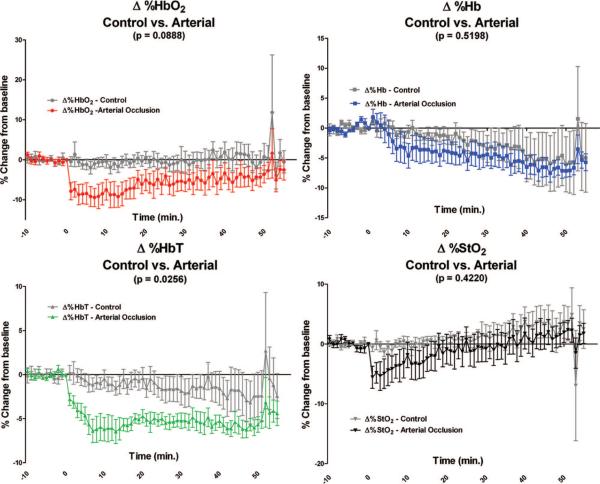
Fig. 4.
Graphic illustration of the percentage changes from baseline for each parameter measured in the control flap group compared with the selective arterial occlusion flap group (note the scale differences on the y axis). Baseline measurements are from −10 minutes to 0 minutes. Selective arterial occlusion occurred at time 0 minutes. The p values reflect the differences over the entire time course between the curve representing the control flap group (gray) and the selective arterial occlusion flap group (color). Only percentage change in total hemoglobin was found to be statistically different between the control flap group and the selective arterial occlusion flap group over the entire postocclusion time course (time 0 to 55 minutes). A Bonferroni posttest analysis did not reveal statistically significant differences at any given individual time point in any of the four chromophore parameters (percentage change in oxyhemoglobin, deoxyhemoglobin, total hemoglobin, and tissue saturation).

