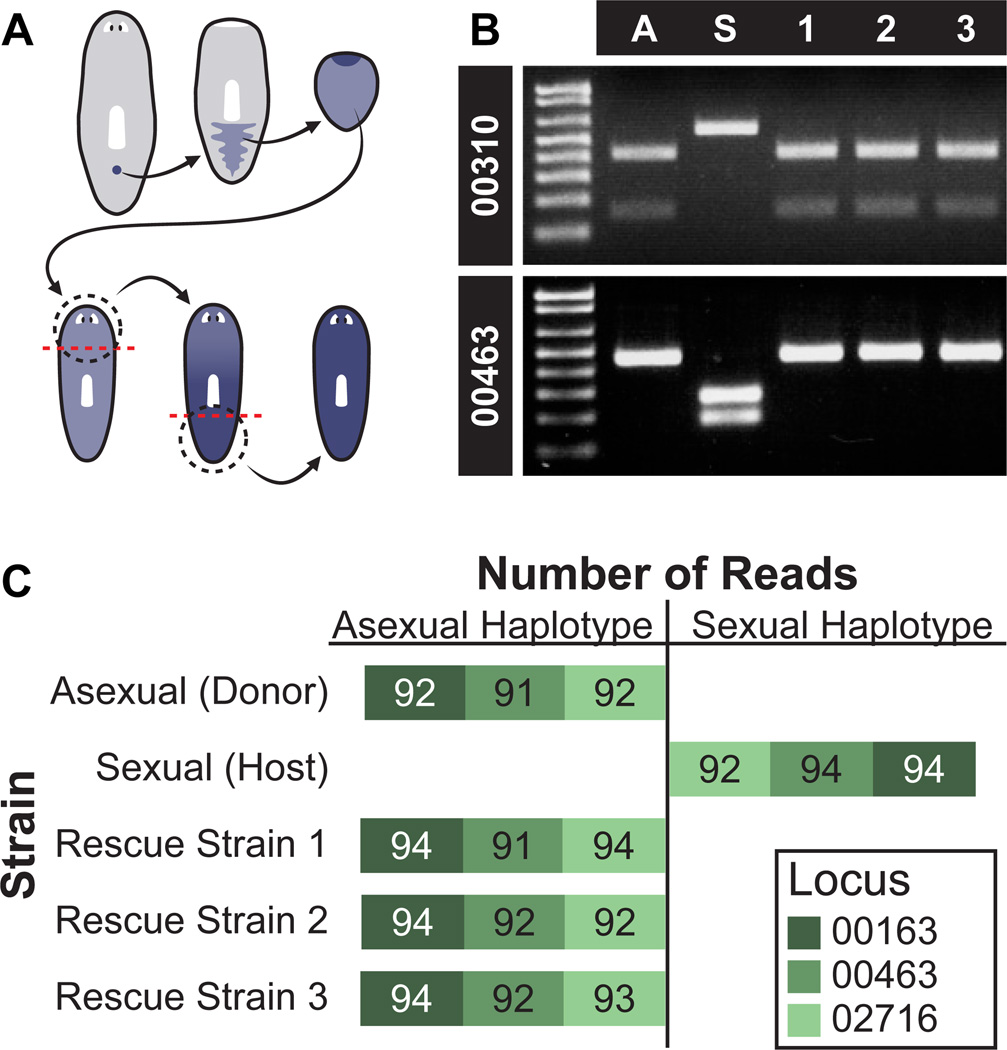
Figure 6. Genotype conversion by single transplanted cNeoblasts.
(A) Schematic showing replacement of host tissue by transplanted donor cells (blue); animals for genotyping were amputated (dotted line) and allowed to regenerate twice. (B) PCR-RFLP analysis of rescued strains. Locus 00310 was cut by HpaI in sexual animals (S) but not asexual animals (A) or the rescued strains (1, 2, 3). Locus 00463 was cut by ScaI in asexual animals and the rescued strains, but not in sexual animals. (C) Haplotype sequencing. Stacked histogram representing number of sequencing reads from each locus for each strain. Bars extend left for number of reads corresponding to the asexual haplotype and right for number of reads corresponding to the sexual haplotype. Bar absence indicates no reads.

