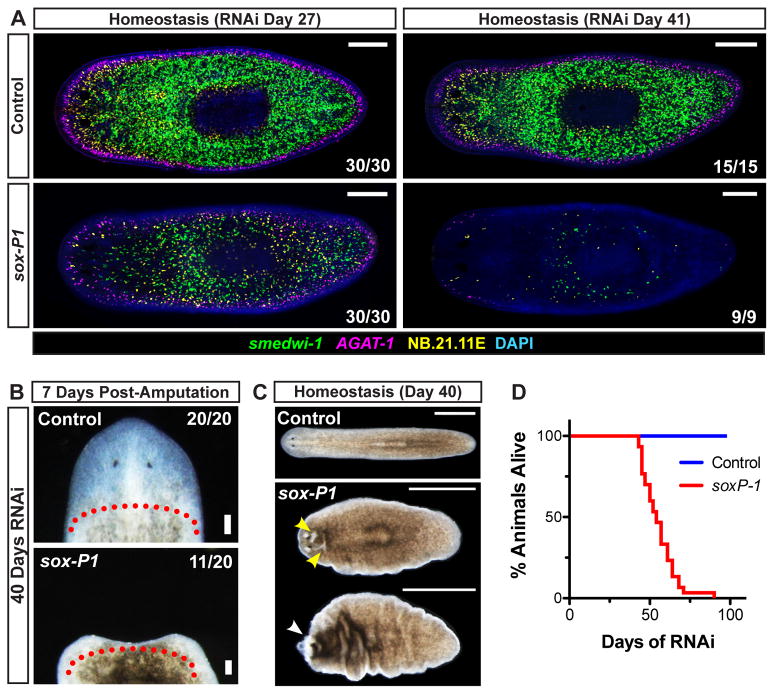
Figure 5. Smed-soxP-1 is Required for Maintenance of smedwi-1+ Cells, Tissue Homeostasis, and Regeneration.
(A) Animals were assessed for proliferative (smedwi-1+) and post-mitotic (AGAT-1+ and NB.21.11E+) cell types after several weeks of RNAi. Shown are representative confocal planes, anterior left. (B–C) Regenerative ability and tissue homeostasis were assessed after 40 days of RNAi. (B) Representative live images of head regions 7 days post-amputation are shown, anterior up. Approximate amputation plane is indicated by dotted line. (C–D) Tissue maintenance and animal survival after continuous RNAi feedings every 3–4 days (n ≥ 30 animals/sample). (C) Representative live images of whole animals undergoing tissue failure, anterior left. Epidermal lesions and head regression are indicated by yellow and white arrowheads, respectively. (D) Survival curves. Scale bars 200 μm (A), 100μm (B), 1mm (C).

