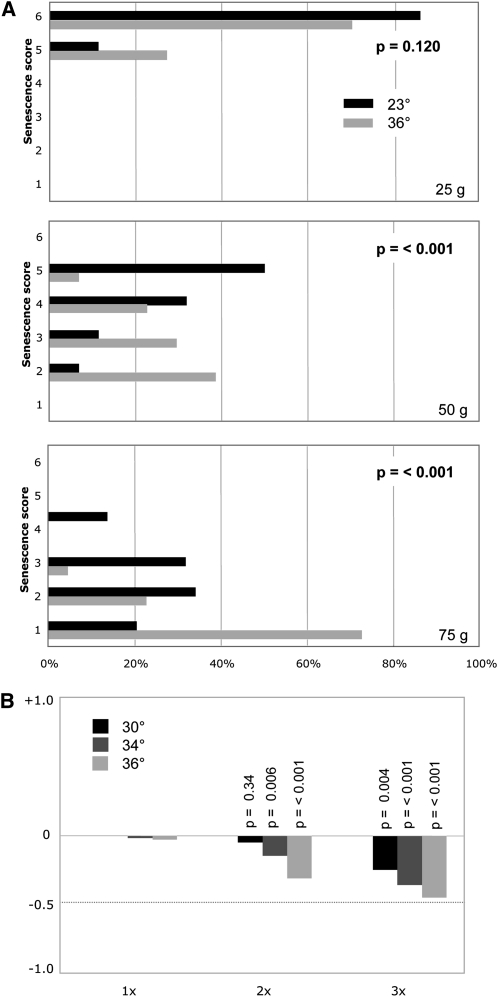
Figure 2 .
(A) Histogram displaying the growth characteristics of 42 tlc1-Δ isolates grown at 23° vs. 36° for three successive streak-outs, corresponding to ∼25, ∼50, and ∼75 generations of growth; isolates were scored for six phenotypic categories, ranging from a scale of 1 (severe senescence) to 6 (comparable to wild-type growth), and a Student’s t-test was used to assess the statistical significance between the two temperatures, as described previously (Gao et al. 2010). (B) Averaged phenotypic scores for the 42 tlc1-Δ isolates propagated at 30°, 34°, or 36° were normalized to growth at 23°, with a negative value indicating enhanced senescence at a given time point, relative to the behavior of the same set of isolates at 23°.

