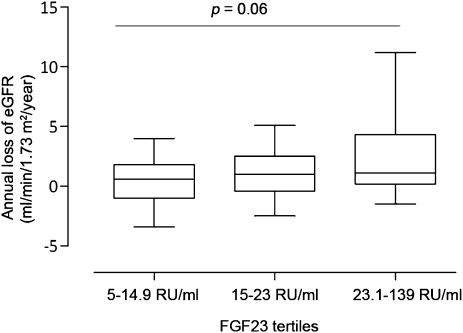
Figure 3.
Relation between fibroblast growth factor-23 (FGF23) and annual loss of estimated GFR (eGFR). The annual loss of eGFR (negative eGFR slope) is shown over FGF23 tertiles. The P value is the result of nonparametric ANOVA test comparing all tertiles. The lines in the box plots and the error bars are median and 10–90 percentiles.

