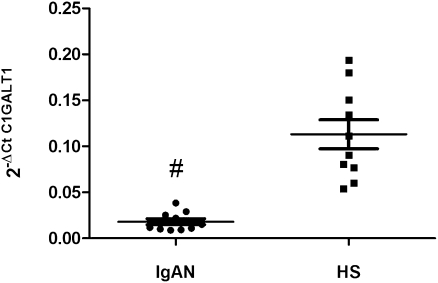
Figure 3.
C1GALT1 gene expression levels evaluated by real-time PCR in 10 patients with IgAN and 10 healthy subjects (HSs). C1GALT1 expression levels were significantly lower in patients with IgAN than in HSs. C1GALT1 expression levels were normalized on the housekeeping gene β-actin. The scatter plots represent the mean ± SEM. #P<0.0001.

