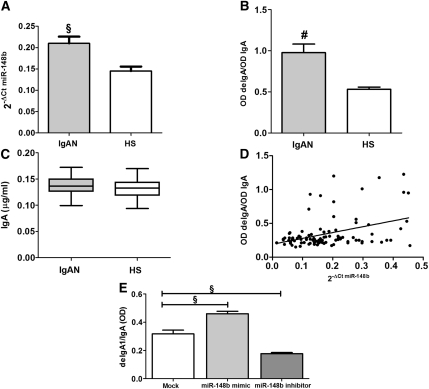
Figure 8.
miR-148b regulates Gal-deficient IgA1 levels. (A) The miR-148b expression levels evaluated by real-time PCR in 50 patients with IgAN and 50 healthy subjects (HSs). miR-148b expression levels were significantly higher in patients with IgAN than in HSs. miR-148b expression levels were normalized to the expression of U6. The histograms represent the mean ± SEM. §P<0.001. (B) shows the serum levels of Gal-deficient IgA1 in patients with IgAN and HSs. The Gal-deficient IgA1 was significantly higher in sera obtained from the patients with IgAN than in sera from HSs. The relative lectin binding per unit IgA1 was calculated as the OD value of lectin over the OD value of total IgA. (C) The serum level of total IgA in patients with IgAN and HSs determined by ELISA. IgA levels in sera obtained from 50 patients with IgAN and 50 HSs were similar. The histograms represent the mean ±SEM. #P<0.0001. (D) Linear correlation between the expression of miR-148b and the Gal-deficient IgA1 levels in 50 patients with IgAN and 50 HSs. miR-148b levels directly correlated with Gal-deficient IgA1 levels (r=0.4,; P<0.0001). (E) The Gal-deficient IgA1 levels in supernatants obtained from DAKIKI cells after transfection with miR-148b mimic and inhibitor. A significant increase in Gal-deficient IgA1 production was shown in DAKIKI cells transfected with 50 nM miR-148b mimic (1.5-fold increase). On the contrary, the transfection with 500 nM miR-148b inhibitor led to a significant reduction in Gal-deficient IgA1 levels (1.8-fold). The relative lectin binding per unit IgA1 was calculated as the OD value of lectin over the OD value of total IgA. The histograms represent the mean ± SEM. §P<0.001.

