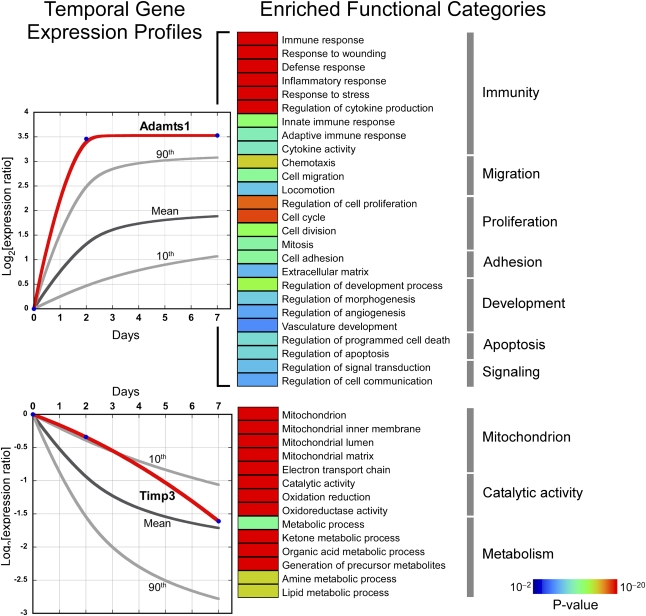
Figure 1.
Global analysis of kidney pericyte transcriptome in response to UUO injury. Temporal changes in gene expression map to two distinct clusters characterized by progressively increasing or decreasing patterns. In each graph, the dark gray line corresponds to the average change in gene expression in response to injury relative to baseline expression (day 0) and the light gray lines identify the 90th and 10th percentiles of each group. The temporal expression patterns of two genes, Adamts1 and Timp3, are depicted with red lines. Gene members of each cluster underwent functional analysis based on Gene Ontology database annotations. Enriched functional categories among upregulated and downregulated genes are shown using color-coded bars corresponding to enrichment P values with the most highly significant shown in red and the least significant shown in dark blue.

