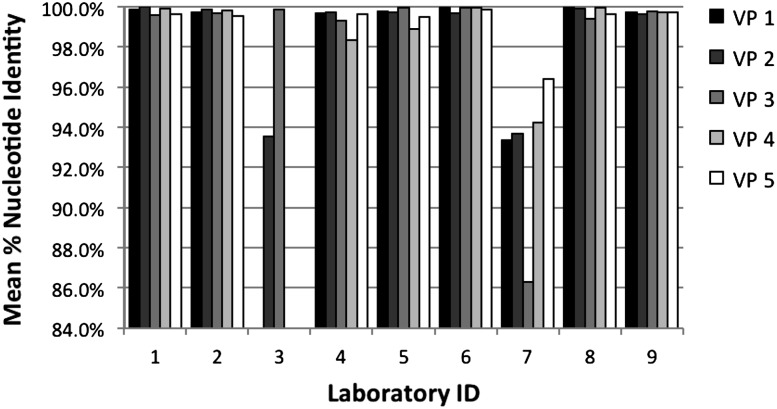
Figure 2.
Dried blood spot validation panel sequence accuracy. Mean percentages of nucleotide identity from comparison with the cross-laboratory consensus sequences are shown for each specimen in bars of different shading. Laboratory 3 did not generate results for VP4 or VP5. Sequences from laboratory 7 contained gaps in the required minimum region (see Methods).

