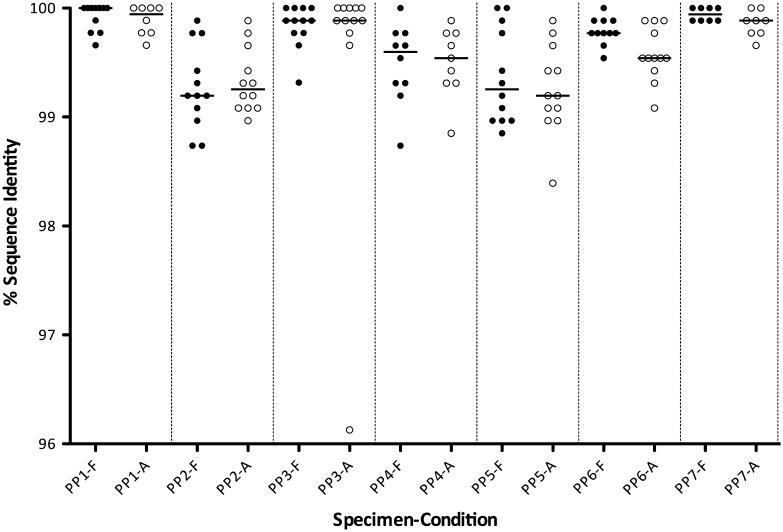
Figure 3.
Dried blood spot (DBS) proficiency panel accuracy results. Each point represents the nucleotide identity score, compared with the consensus sequences for DBS that were shipped frozen on dry ice (F; filled circles) or at ambient temperature (A; open circles). Horizontal bars for each group represent the median values.

