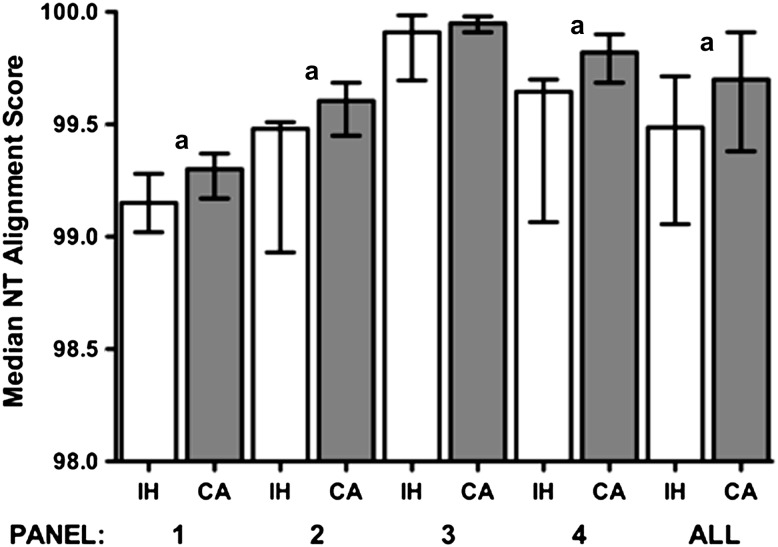
Figure 1.
Comparison of median nucleotide alignment scores for the different panels and assay methods. Error bars represent the interquartile range. White bars indicate in-house (IH) assays, gray bars indicate ViroSeq or TruGene commercial assay (CA). aMann–Whitney P values for IH versus CA (panel 1: P = .019; panel 2: P = .023; panel 3: P = .15; panel 4: P =.0029; all, P = .0035. Abbreviation: NT, nucleotide.

