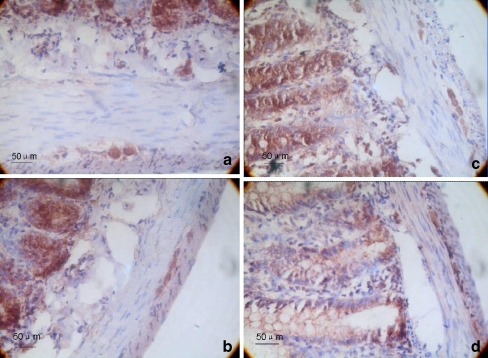
Fig. 4.
Immunohistochemistry of ChAT expression in the myenteric plexus. a, c The gastric antrum and colon tissue of the control group, respectively. b, d The gastric antrum and colon tissue of the 6-OHDA group, respectively. The magnification is ×400. On the fourth week, the gastrointestinal tracts of 10 rats from each group were examined by immunohistochemistry. We calculated the average integrated optical density in ChAT-immunoreactive regions of the gastric antrum and the colon. A brown color indicated ChAT-positive neurons. The average integrated optical densities of the ChAT-positive areas of the gastric antrum and the proximal colon myenteric plexus in the 6-OHDA group were 109.36 ± 3.37 and 104.73 ± 5.93, respectively. These values were not significantly different from those of the control group (112.02 ± 4.94, 104.83 ± 4.35; P > 0.05; n = 10)

