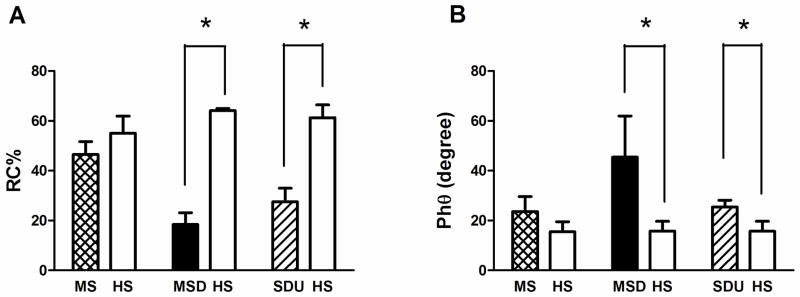
Figure 2.
Rib cage contribution to the tidal volume excursions (A); phase angle (B); and phase relation during total breath (C) trends between subgroups. MS: Morquio syndrome; MSD: Metatropic and spondylocostal; SDU: Unspecified skeletal dysplasias; HS: Reference values of healthy subjects.*p< 0.05 vs. HS. # p<0.05 differences between subgroups. Data expressed as mean ± SE; %RC= Rib cage contribution to the tidal volume excursions; PhRTB= phase relation during total breath; and Phθ= phase angle.

