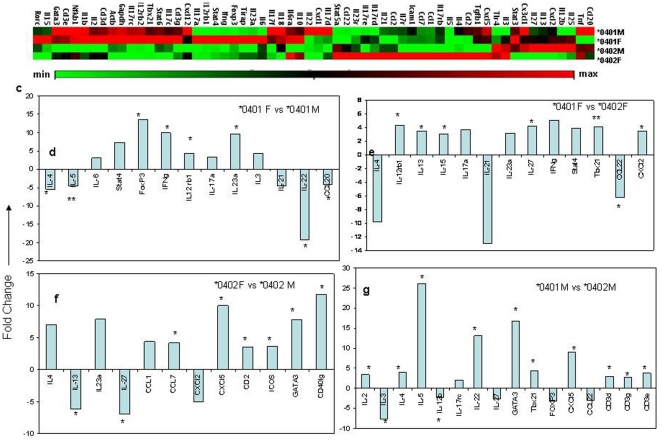
Figure 6. A)) Heat map showing expression levels of cytokines and chemokine transcripts in jejenum of *0401 and *0402 male and female mice (n = 3 in each group).
(b) Comparison of fold change in gene transcript levels between *0401 females and males, (c) *0402 females and males, (d) females of each genotype and (e) males of each genotype. Results are given as fold-changes of mean copy-numbers relative to the mean copy-numbers of the comparative group. *P<0.05 and **P<0.01 and more. Data points with 3 or more fold differences and significance of more than P<0.05 are shown.

