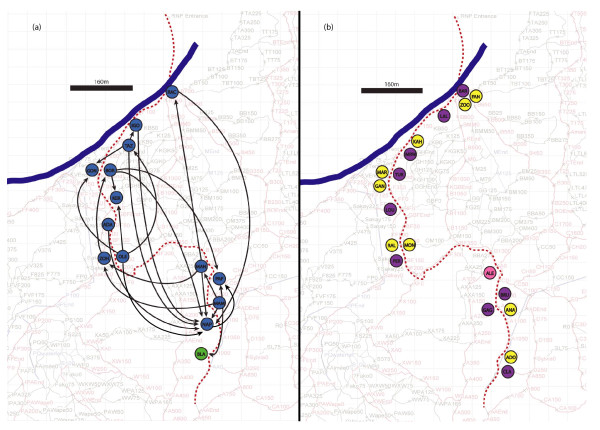
Figure 1.
Map of lemur social contacts, spatial plots of lemur trapping locations and recorded louse transfers. The dotted line represents the trapping transect (1km), the blue line represents the Namorona River, the circles represent the average trap locale for each lemur (identified with a three-letter code). 1a. Schematic representation of recorded louse transfers. Blue circles are males that donated or donated/received; the green circle is the one male that only received lice. A black line connecting two dots indicates at least one recorded transfer between those lemurs. 1b. Trap locales for lemurs which did not engage in recorded transfers. Yellow circles denote males not involved in observed transfers, purple circles denote females that never had lice, and pink circle denotes the only female that had lice.

