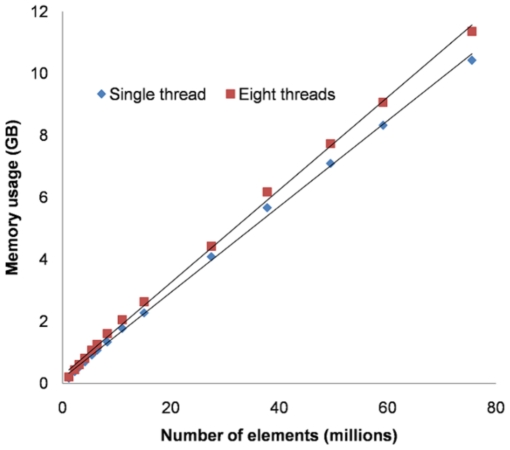
Figure 5. Average time per iteration (seconds) versus number of elements (millions) for running  FE simulations on sub-volumes of a single
  CT image using one, two, four, and eight threads respectively.
Symbols represent experimental data points, straight lines are best fits. Linear relationships were found in all cases with R2≥0.998.

