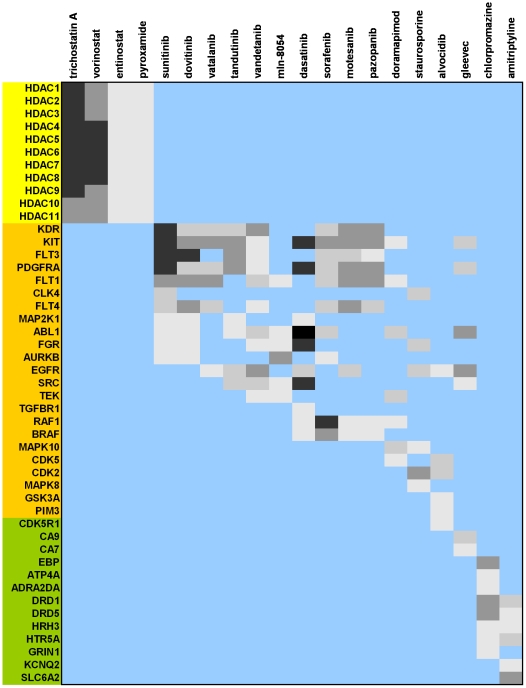
Figure 6. Profiles of experimental affinity data of the 20 drugs, among 4,819, hitting more than 5 targets found solely in tumor selective compounds.
Only affinities above 1 µM are considered. Color coding reflects pAffinity ranges: white 6–7; light grey 7–8; dark grey 8–9; black >9. Color codes for targets refer to HDACs (yellow), kinases (orange), and other (green).

