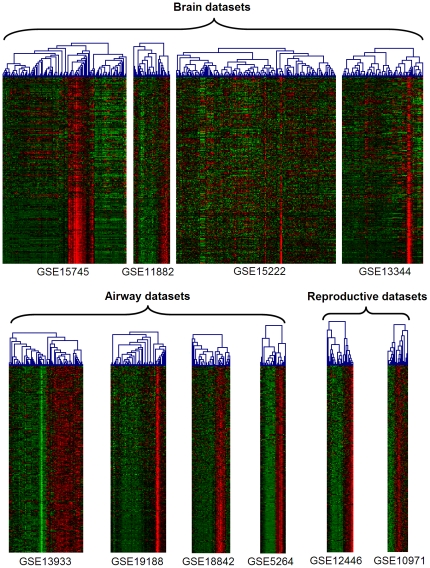
Figure 2. Heatmaps of consensus ciliary signature in 10 contributing datasets.
Red - high, green - low level of expression. Columns – samples, rows – genes. Samples were clustered separately in each dataset. Genes were ordered by the number of datasets in which they belonged to the ciliary module: the gene order is constant across the datasets. Genes, that lacked measurements in a subset of the experiments, were excluded from the heatmaps.

