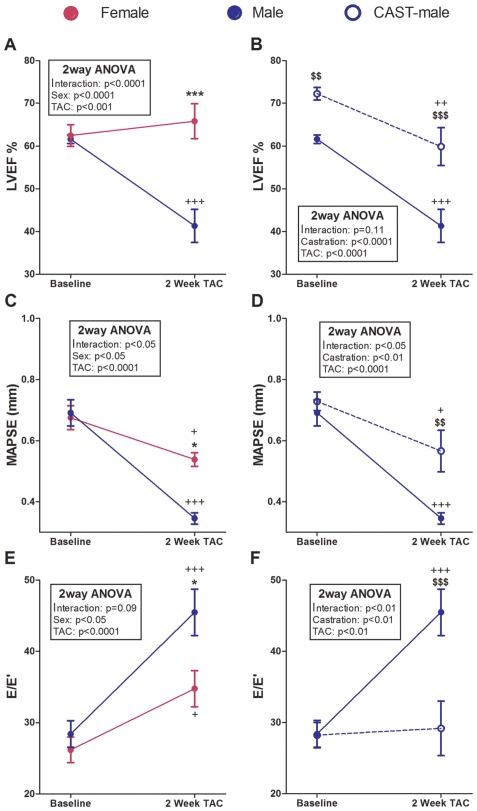
Figure 3. Evolution of the echocardiographic functional changes induced by pressure overload during a 2-week follow-up period in mice subjected to TAC.
LVEF: Left ventricular ejection fraction; MAPSE: Mitral annular plane systolic excursion. E/E′: Peak early transmitral flow velocity (E) to peak early myocardial tissue velocity (E′) ratio. Data are expressed as mean ± SEM. Males vs. females: *p<0.05, ***p<0.001; TAC vs. same group baseline: +p<0.05, +++p<0.001; CAST vs. intact: $$p<0.01, $$$p<0.001. (Repeated-measures two-way ANOVA and Bonferroni post-hoc test).

