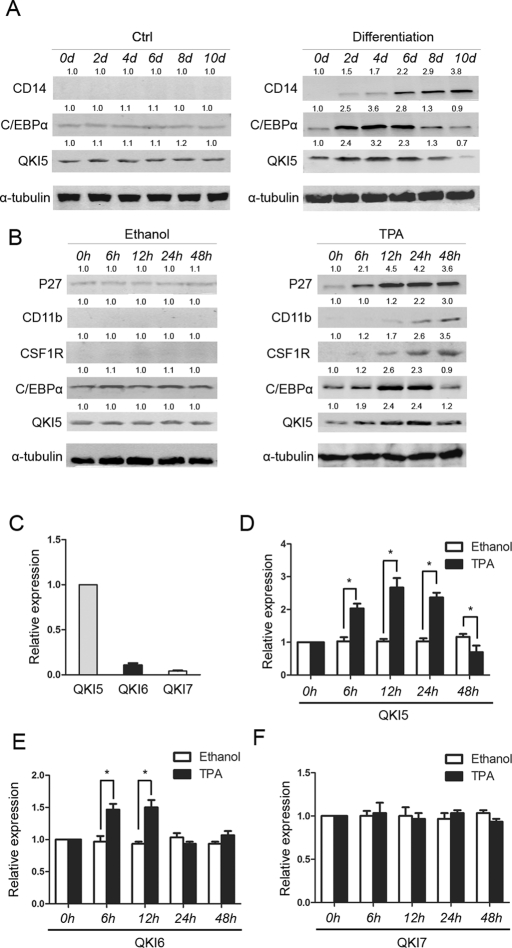
FIGURE 1:
Dynamic expression of QKI during monocyte–macrophage differentiation. (A) The CD34+ cells were induced toward macrophage differentiation, and QKI expression was analyzed by Western blot analysis. CD14 served as an indicator of macrophage differentiation, and tubulin served as an internal control for equal loading. (B) The HL-60 cells grew for the indicated times in the presence of 32 nM of TPA. The expression levels of QKI, CSF1R, C/EBPα, and the differentiation marker CD11b were analyzed by Western blot. (C) The cells were treated in the same manner as described, and the RNA expression of the three QKI isoforms was analyzed by qRT-PCR. GAPDH served as an internal control. The dynamic changes of QKI5 (D), QKI6 (E), and QKI7 (F) during differentiation were calculated by comparing the levels with the ethanol control.

