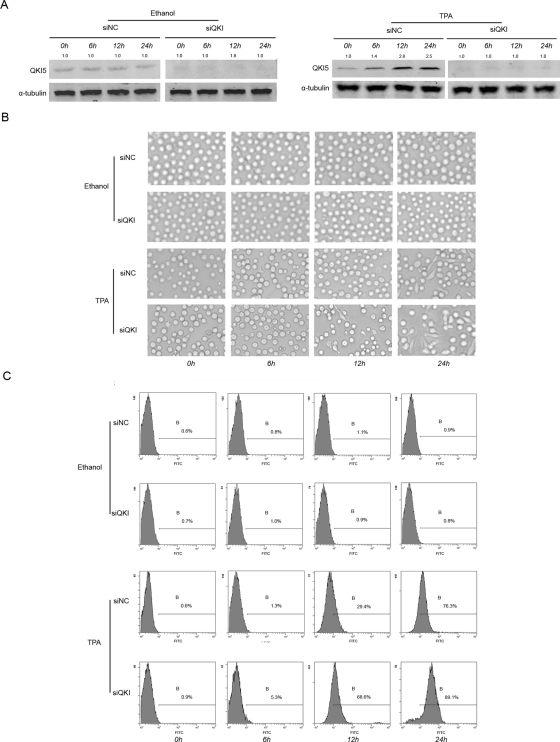
FIGURE 4:
Knockdown of QKI-facilitated monocyte–macrophage differentiation. HL-60 cells were transfected with 100 nM siRNA against QKI or the NC siRNA and then were induced by 32 nM TPA or ethanol for the indicated time. (A) The knockdown efficiency of QKI during the different periods. (B) The cell morphology was viewed and imaged using a microscope. The siQKI-treated cells displayed a monocyte-macrophage–like appearance much earlier than the control. (C) The CD14+ population was analyzed by FACS. The data presented are representative of three different experiments.

