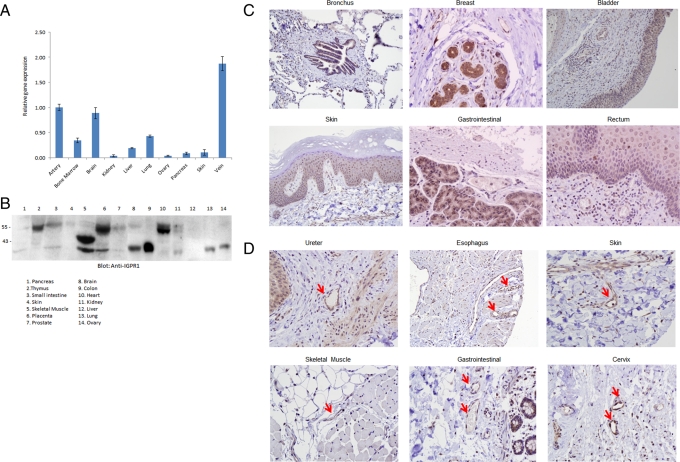
FIGURE 2:
Expression of IGPR-1 in human organs and tissues. (A) Total RNA derived from various human organs was subjected to qPCR using primers specifically designed to amplify exons 2 and 3 of IGPR-1. The relative levels of IGPR-1 are shown. (B) Cell lysates derived from various human tissues were subjected to Western blot analysis using anti–IGPR-1 antibody. The human tissue microarray of normal human tissues is stained for IGPR-1. The array was viewed under light microscope and pictures were taken at 20× (C) or 40× (D). The red arrow indicates blood vessels.

