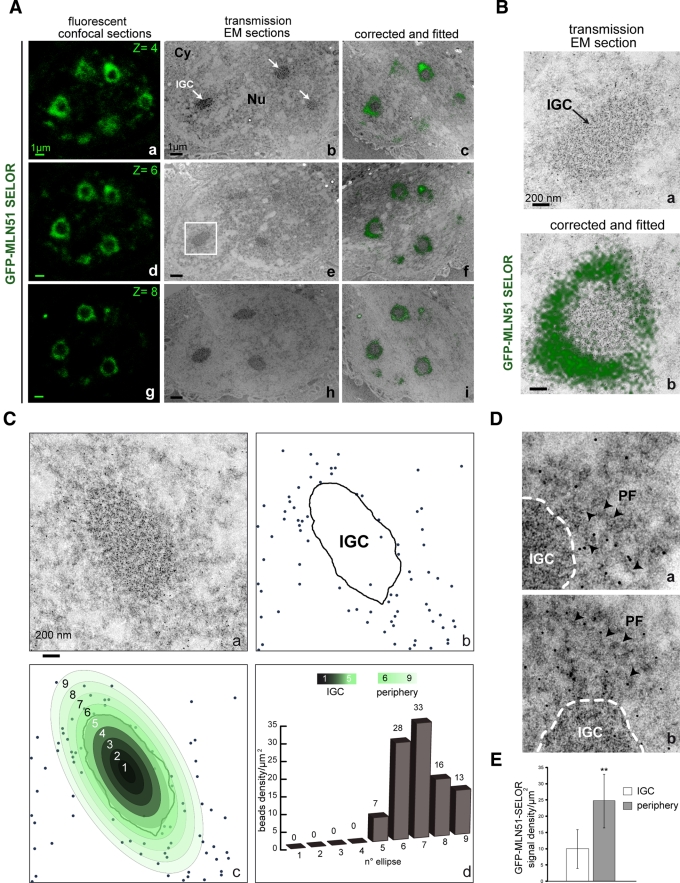
FIGURE 6:
Ultrastructural characterization of the perispeckle region by CLEM. MCF7 cells were transiently transfected with GFP-MLN51-SELOR construct and then processed for microscopy analysis and immunogold labeling by CLEM. (A) GFP-MLN51 SELOR is present at the periphery of IGCs. Left, three representative images of GFP signal are live confocal z-sections (a, d, g). Middle, transmission EM images were acquired from thin sections (b, e, h). Right, fitting between light and electron microscopy acquisitions was performed after EM image compression (c, f, i). Nuclear speckles, also called IGCs, are indicated with white arrows (b) inside the nucleus (Nu). A thin cytoplasmic strip is observable (Cy). Scale bar, 1 μm. (B) The GFP signal fits at the periphery of the nuclear speckle. A selected area in A, e (white square), was enlarged with transmission EM section (a) and the corresponding fitted image (b). (C) The GFP signal is enriched in the close vicinity of nuclear speckles. (a) A nonfitted view of a representative IGC immunogold labeled with GFP-specific antibody. (b) Schematic representation of the GFP-specific immunogold labeling; the black line indicates the IGC territory, and gold beads are highlighted with blue dots. (c) Radial distribution of the labeling densities within and around the IGC territory; the central IGC domain is separated into five concentric ellipses and is surrounded by four similar and peripheral circles (pseudocolored from dark gray to light green). Each ring is independently analyzed to determine the radial variation in labeling density. (d) Histogram representing the labeling density of the GFP-MLN51 SELOR signal in concentric nuclear ellipses per surface unit in μm2. From left to right, bars depict the IGC center to the peripheral environment. (D) Gold particles are associated with perichromatin fibrils. (a, b) Enlarged regions showing the distribution of the GFP labeling around the IGC (dashed line). Gold particles overlap with filamentous structures in a less granular region, corresponding to perichromatin fibrils (PF, arrowheads). (E) The GFP-MLN51 SELOR signal is enriched at the periphery of IGC. Graph representing the preferential distribution of GFP-MLN51 SELOR at the periphery of IGC. The mean labeling density of gold particles per surface unit in μm2, which marks the presence of GFP-SELOR, was quantified inside IGCs vs. periphery ± standard deviations. The p value was obtained from Student's statistical t test; **p < 0.01.

