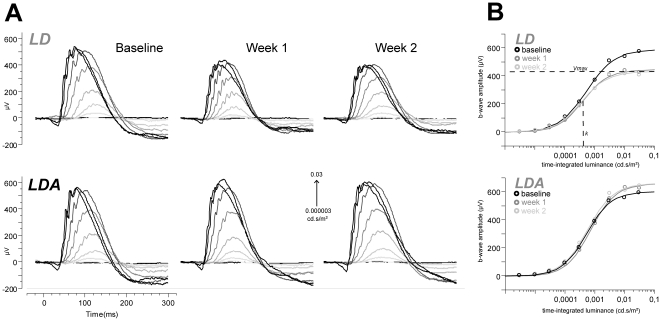
Figure 1. Scotopic sensitivity function and corresponding ERG curves in LD and LDA rats.
(A) ERG responses to 9 flashes of increasing stimulus strength (0.000003–0.03 cd.s/m2) under dark-adapted condition for representative rats of each group (LD, LDA). Examinations are shown for baseline measurement, 7 days (7 d) and 14 days (14 d) after light damage. A decrease of ERG potentials were indicated in the LD group after light damage. The LDA group shows an increase of amplitudes after light damage due to normal growth. (B) Scotopic fits (described by Vmax, k and n) of the same measurements as illustrated in A: The b-wave amplitudes (µV) were fitted against stimulus strength (cd.s/m2). Points demonstrate single ERG b-waves with increasing stimulus strength. The fits show the increase in amplitudes during the whole study period in the LDA group and the decrease of amplitudes in the LD group after light damage (note the difference between baseline and 7 d and 14 d in both groups).

