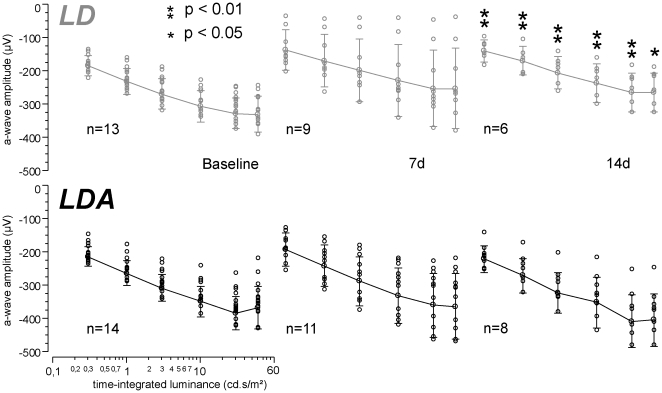
Figure 2. Comparison of a-wave amplitudes between LD and LDA rats at rising stimulation strengths.
A-wave analysis at different stimulus strengths (0.3–60 cd.s/m2) measured under dark adapted condition. For descriptive analysis means were connected (line) and standard deviations were marked (whiskers). Single measurements of a-waves are illustrated by points. A significant difference between both groups (LD vs. LDA) was detected at 14 days after light damage (* = p<0.05, ** = p<0.01). Higher amplitudes were measured for the LDA group.

