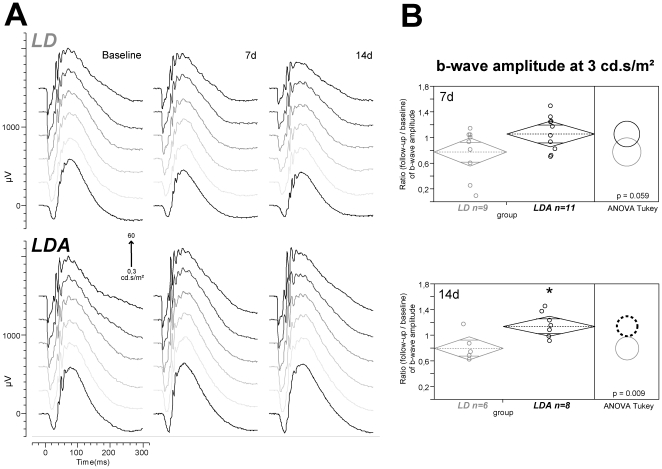
Figure 3. Mixed rod-cone b-wave amplitudes compared between LD and LDA rats.
(A) Examples of ERG waves elicited by stimulus strengths rising from 0.3 to 60 cd.s/m2 under dark adapted conditions for both groups (LD, LDA) and three measurements (baseline, 7 days (7 d) and 14 days (14 d) after light damage). A decrease of amplitudes was detected after light damage in the LD group. The application of anesthesia before light damage (LDA group) could protect retinal function against degeneration. (B) Statistical analysis of b-wave amplitudes at 3 cd.s/m2 under dark adapted conditions illustrated by diamonds of agreement with mean (middle line within the diamonds) and 95% confidence interval (upper and lower corners of the diamonds). The dashed circle indicates the statistical significant difference between groups (LDA with significant higher amplitudes marked black [group and circle]; ANOVA with post hoc Tukey's analysis p = 0.059 at 7 d and p = 0.009 at 14 d).

