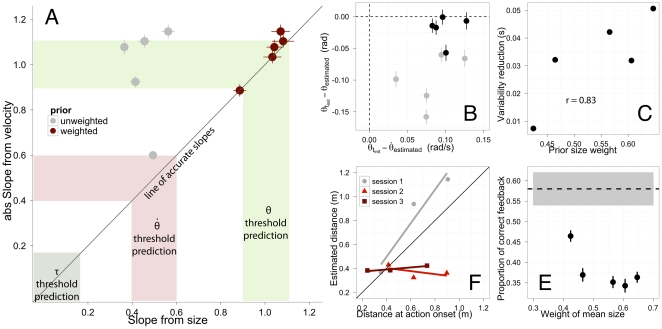
Figure 2. Summary of the results.
(A) Slopes (in absolute value) identifying the relationship between time of action initiation and velocity (log-log coordinates) are plotted against the slopes between action initiation and size. Accurate values should be close to the unity line ( =
=  resulting from fitting Eq. 9). Accurate slopes will be close to one if a visual angle threshold is used to start the action of catching (green-shaded area). If a rate of expansion threshold, the slopes will be close to 1/2. Finally the slopes will be close to zero if
  is used. The slopes were obtained either with weighting prior information (red dots) or without (grey dots). (B) Individual differences between actual
  and the estimated
  threshold (intercept of Eq. 9) against the same differences for rate of expansion
  . (C) Variability reduction as a function of the weight given to the prior size for each subject. (D) Estimated distance against actual (simulated) distance at action onset. Estimated distance is the slope
  of the linear model that relates velocity and movement time:
  . The fit was done separately for different sessions. (E) Proportion of responses that have been initiated within the time window of 30 ms around the actual arrival time as a function of the weight given to the mean size. Single points denote individual subjects and the error bars stand for the binomial 95% confidence intervals. The dashed line is the average proportion of accurate responses in the control condition and the shaded are denotes the 95% confidence limits.

