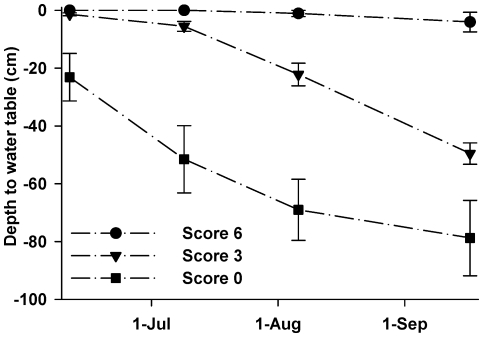
Figure 3. Water table dynamics.
Mean depth to water table by meadow hydrology score for 10 meadows in the High Sierra Ranger District, Sierra National Forest, California, USA, during 2008. Hydrologic scale ranged from 0 to 6, with 0 representing drier sites and 6 representing the wettest sites. Water tables diverged over the summer: wet sites (score 6) experienced a mean seasonal drawdown of 4 cm while drier sites (score 0) experienced an mean seasonal drawdown of 79 cm. Vertical bars represent ±1 SE.

