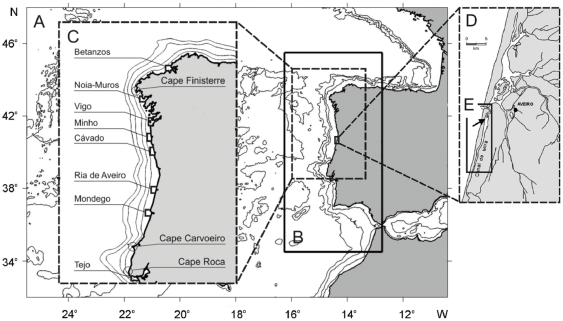
Figure 1. Map of the study zone and model domains.
(A) first domain (FD); (B) large domain (LD); (C) location of estuaries used in the model showing the shelf area adjacent to each estuary where larvae were emitted and recruited; (D) Ria de Aveiro; and (E) Canal de Mira. (C) also shows details of the 50, 100, 250 and 500 m isobaths of the smoothed bathymetry used in the model. Arrow in (E) indicates location where the passive nets were deployed.

