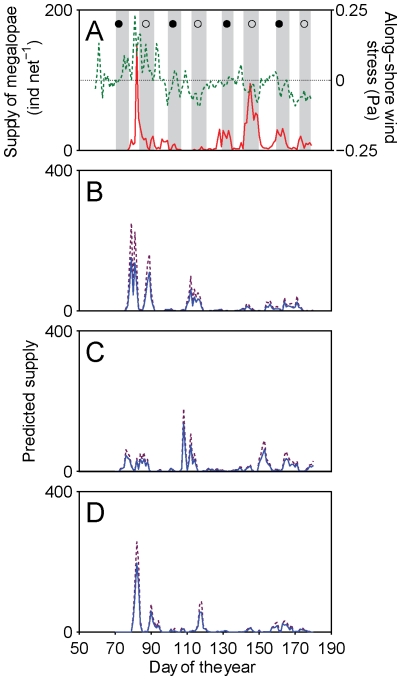
Figure 2. Observed and predicted time series of supply in 2006.
(A) Daily numbers of observed megalopal supply (continuous line), along-shore wind stress (dashed line) and spring tides (tidal range larger than long-term average range, grey bars) in the Ria de Aveiro in 2006; and predicted time series of supply by the Invasion experiments with (B) normal, (C) fast and (D) slow growth rates with (dashed line) and without (continuous line) mortality, for the same year.

