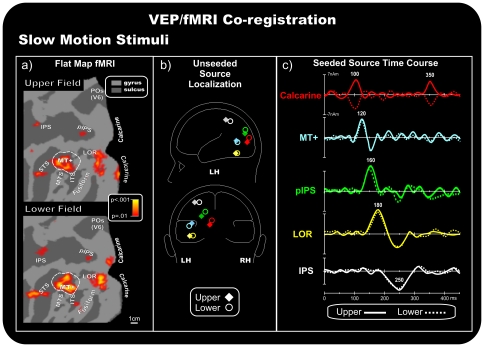
Figure 3. Coregistration of the VEP/fMRI responses to slow motion stimuli.
a) Group-averaged contralateral fMRI activations superimposed on the flattened hemisphere (occipital lobe) of the PALS template. The pseudocolor scale indicates the statistical significance of the fMRI activations. Major sulci (dark gray) are labeled as follows: parieto-occipital sulcus (POS), intraparietal sulcus (IPS), posterior intraparietal sulcus (pIPS), superior temporal sulcus (STS), middle temporal sulcus (MTS), inferior temporal sulcus (ITS), lateral occipital region (LOR), fusiform gyrus (fusiform) and calcarine fissure (Calcarine). The dashed outline surrounding area MT+ represents the group-averaged location of the motion-sensitive cortex based on separate localizer scans. b) Schematic representation of the source locations in the unseeded dipole model. c) Source waveforms of the dipoles seeded to the fMRI activations.

