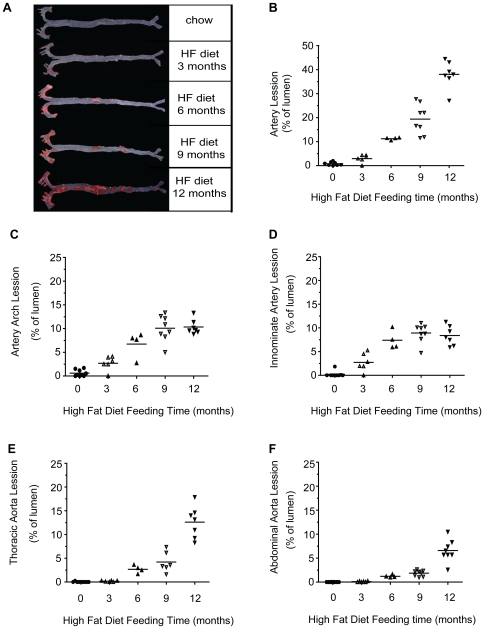
Figure 2. Atherosclerotic lesion progression and location in HF diet-fed Ldlr −/− mice.
Analysis of atherosclerotic lesions was performed using the en face method. Representative images of Sudan IV-stained aorta in Ldlr −/− mice fed the HF diet for 0 to 12 months (A). Lesion-occupied areas in full-length aorta (A), aortic arch (C), innominate artery (D), thoracic aorta (E), and abdominal aorta (F) were quantified and expressed as a percentage of the lumen area in Ldlr −/− mice on the HF diet at 0 month (•), 3 months (▴), 6 months (▾), 9 months (△), and 12 months (▽).

