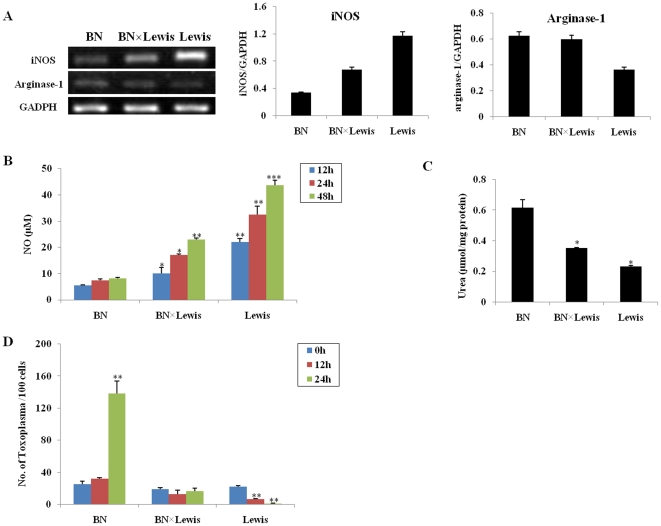
Figure 6. Analysis of iNOS and arginase expression and growth of T. gondii in BN, Lewis and BN×Lewis F1 hybrid macrophages.
(A) (left) RT-PCR for expression of iNOS and arginase-1 mRNA. Amplicons were densitometrically quantified; bars represent relative amounts of amplified iNOS (middle) and arginase-1 (right) mRNA normalized against GAPDH. (B) NO production measured by the Griess reaction at 12 hrs, 24 hrs, and 48 hrs after infection. (C) Arginase activity measured by a colorimetric assay; enzyme activity is the output of urea secreted from lysed macrophages. (D) Number of T. gondii per 100 macrophages at 1 hr, 12 hrs and 24 hrs after infection. Mean ± SEM and significant differences (* p<0.05, ** p<0.01, *** p<0.001) (n = 3).

