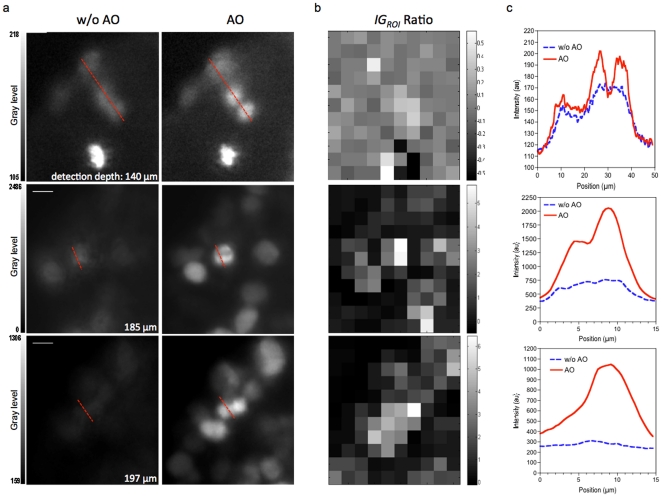
Figure 6. Image quality improvement in depth.
(a) Single planes images of nuclei and mitotic figures at various depths within the MCTS resolved with AO or not (w/o AO). Images are acquired by using the same excitation intensity at 595 nm and same exposure time (300 ms). Scale Bar 5 µm. (b) The corresponding IGROI Ratio image. (c) The corresponding intensity plots along the line indicated.

