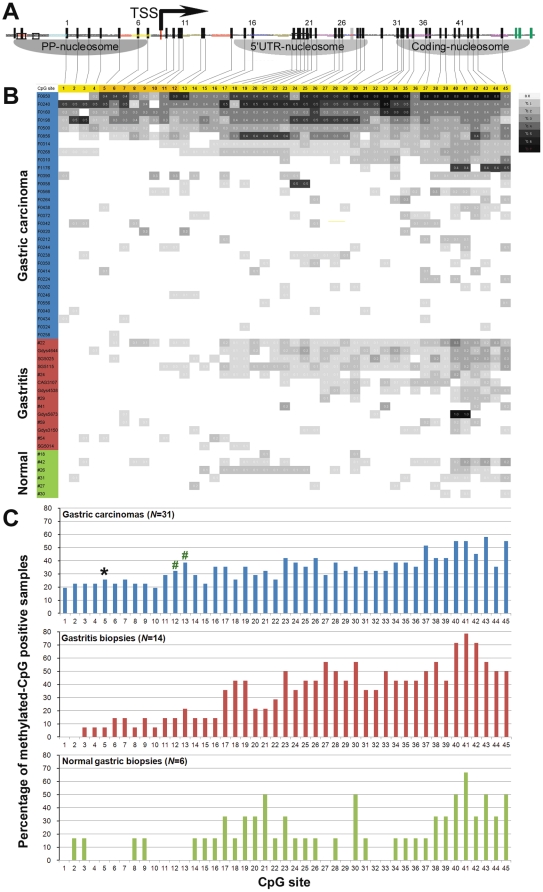
Figure 3. Relationship between nucleosome positioning and methylation of each CpG site within p16 CpG island in human gastric mucosa samples (N = 51).
(A) The detected nucleosome occupancy within a p16 CpG island as displayed in Figure 1B; three seeding methylation CpG sites at 46, 47, and 48 locations are marked with purple color; (B) A gray-graded representation of the average methylation density at individual CpG sites within the p16 promoter and exon-1 region based on the results of all informative clones obtained from each sample using the sMSP-sequencing assay; The methylation density of each CpG site in each tested sample was labeled, 0.1∼0.7 mean 10%∼70%; (C) The positive rate of methylated-CpG at each CpG site in the sequenced gastric tissue samples with various pathological changes. *, The positive rate at the site-5 in GCs is statistically significantly higher than in gastritis and normal samples (Fish exact test, P<0.02). #, The positive rate at the site-12 and 13 GCs is significantly higher than in gastritis and normal when the proportion value of each sample was used in the Mann Whitney test (P = 0.043, two-sides).

