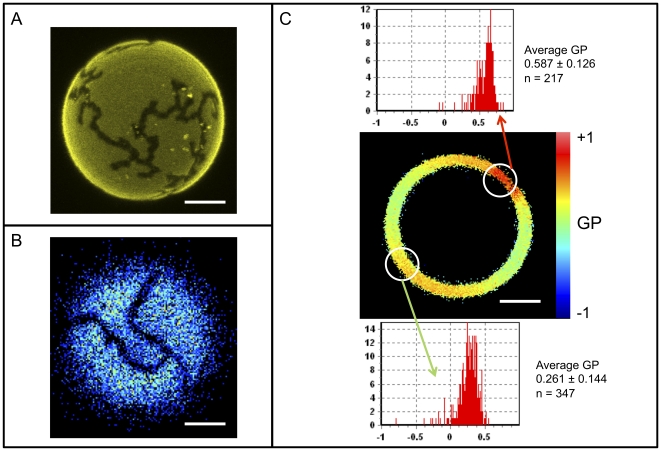
Figure 3. Pre-mixed C12SM∶C12Cer-1-P domains in GUVs.
Representative images of domains in individual vesicles composed of 23 mol% C12Cer-1-P visualized with (A) DiIC18 which is excluded from the C12Cer-1-P-enriched domains, B) LAURDAN intensity image at the pole of a giant vesicle where photoselection prevents probe excitation in the more ordered domains and, C) LAURDAN GP analysis of domains in an equatorial section showing areas of low dipolar relaxation (high GP, top histogram) and higher dipolar relaxation (lower GP, bottom histogram). Histograms were determined opposite to each other to avoid any bias caused by photoselection. Bars are 5 µm.

