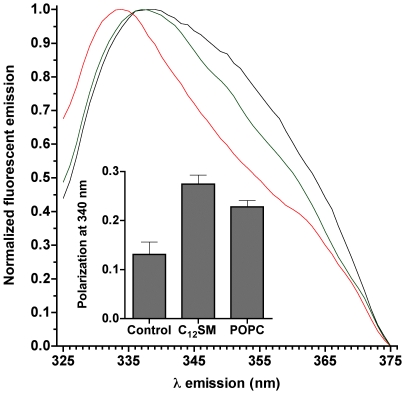
Figure 11. Protein fluorescence spectra of SMD.
The main panel shows the normalized fluorescence emission spectrum of SMD (excitation at 280 nm). The black trace is SMD alone, mixed with POPC vesicles (green) and with C12SM LUVs (red). Inset: fluorescence polarization values for the same samples. The differences in polarization are statistically significant (P<0.003).

