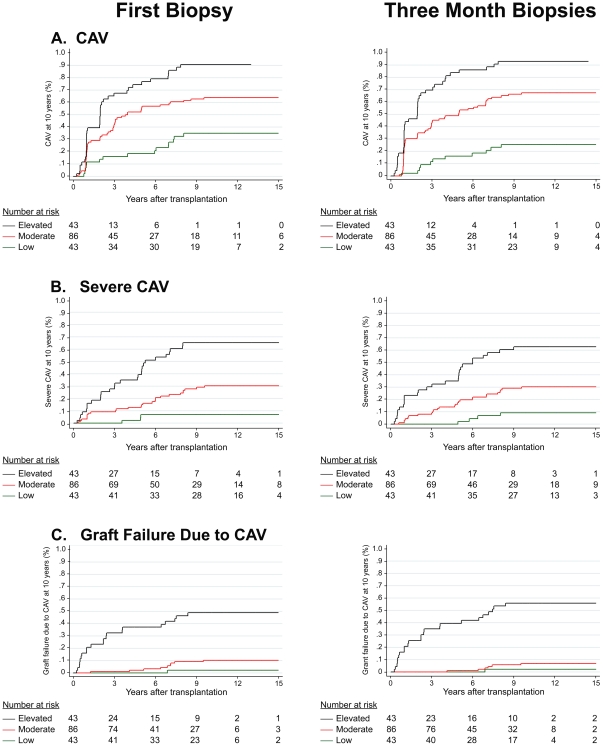
Figure 2. Kaplan-Meier curves using 10-year regression models.
Kaplan-Meier curves of risk-stratified groupings derived from first-biopsy versus three-month biopsy models showing time to (a) CAV, (b) severe CAV, and (c) failure due to CAV. Risk groupings were formed from the distributions of the predictive probabilities from 10-year logistic regression models (low risk = lower 25%, moderate risk = middle 50%, and high risk = upper 25%).

