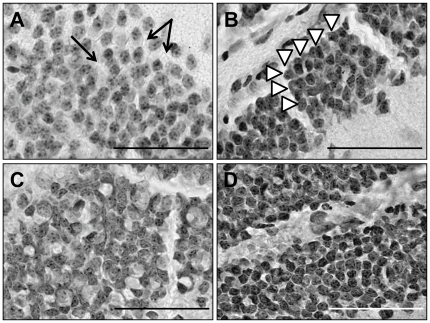
Figure 5. Organizational differences in the granule cells of the DG.
Untreated disomic brains (A) had a lower density of granule cells, with a correspondingly larger cell diameter. Similar results were reported for untreated trisomic mice (C). In both groups, the granule cell layer appears less organized in that there was more space between the cells (arrows in A) and randomness to their location within the layer. In contrast, in the Disomic/mNPC mice (B) and Trisomic/mNPC mice (D), both of which had smaller cell diameters and a tendency towards a higher cell density, have a more organized appearance. The granule layers of these groups have tightly aligned cells, which sometimes appear to be in rows and columns (arrow heads in B). Scale bars in A–D are equal to each other and represent 100 µm.

