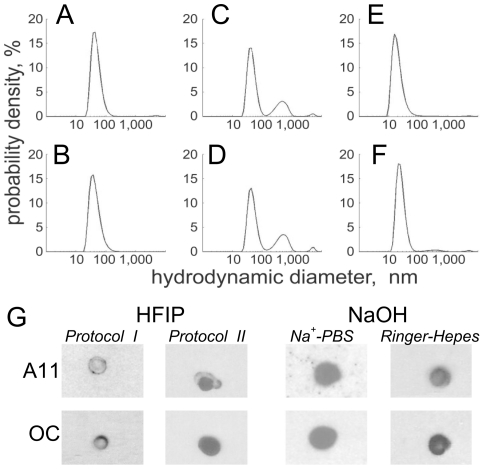
Figure 1. Size and conformation of Aβ1–42 aggregates.
(A–F) Size distributions of Aβ1–42 aggregates at different time points, as determined with DLS. (A–D) Aβ1–42 samples prepared with HFIP: (A, B: protocol I; C, D: protocol II) (E, F) Aβ1–42 samples prepared with NaOH and incubated at pH = 7. A, C, F show samples incubated for 48 h and B, D, F show samples incubated for 4 d at room temperature. Data taken at T = 25±0.1°C. (G) Dot blots probed with A11 and OC antibodies show that both A11-positive and OC-positive material is contained in the Aβ1–42 samples after 4 days of incubation. Representative blots are shown (n≥2 for each condition).

