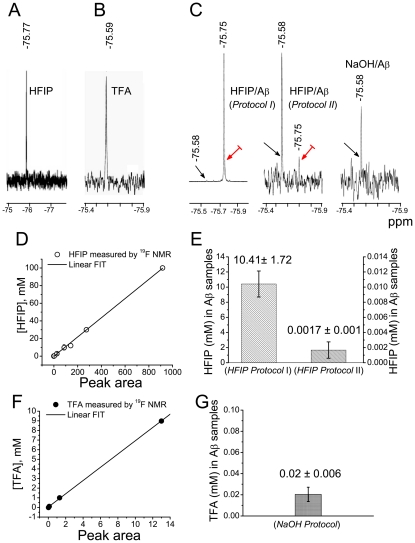
Figure 2. Quantification of HFIP and TFA in aqueous solutions by 19F NMR.
(A) Aβ-free aqueous solution spiked with 0.1 mM HFIP. (B) Aβ-free aqueous solution spiked with 0.13 mM TFA. (C) 19F NMR spectra of Aβ1–42 oligomer samples prepared using HFIP protocol I, HFIP protocol II, and the NaOH protocol. The signal amplification differs greatly between spectra as indicated by the different noise levels. The concentrations of Aβ1–42 and HFIP prior to evaporation were 70 μM and 1.2 M. Black and red arrows indicate peaks originating from residual TFA and HFIP, respectively. (D, F) Calibration standards generated by integrating the area under the 19F peaks obtained from samples with known HFIP (D) or TFA (F) concentrations. The lines correspond to the best fits through the origin (R 2 = 0.999 for both fits). (E) HFIP concentrations ± S.E.M. in stock Aβ1–42 samples prepared according to HFIP protocols I (n = 6) and II (n = 7). (G) TFA concentration ± S.E.M. in stock Aβ1–42 samples prepared according to NaOH protocol (n = 2).

