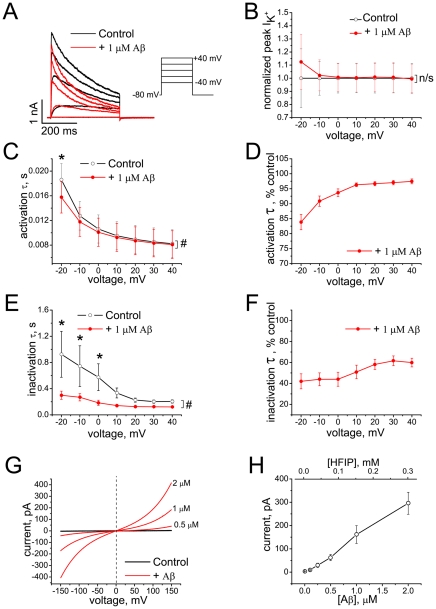
Figure 4. Effect of Aβ1–42 oligomers (HFIP protocol I) on Kv 1.3 currents and on BLM conductance.
(A) Representative K+ currents evoked by depolarizing voltage steps from holding potential of −80 mV before (black) and after (red) application of Aβ1–42 oligomers. (B) Peak K+ currents normalized to mean control values at different voltages before (black) and after application of Aβ1–42 oligomers (red). Data are shown as mean ± S.E.M. (n = 6 cells). HFIP had no significant (n/s) effect on the peak current (F = 0.17; P = 0.69, Two-way RM-ANOVA). (C–F) Activation and inactivation kinetics of K+ currents before (black) and after application of Aβ1–42 oligomers (red) shown in absolute (C, E) and normalized (D, F) values of time constants at different voltages (mean ± S.E.M., n = 6 cells). The effect of Aβ on the activation time constant was significant in Tests of Within-Subjects Effects (F = 46.8; #P = 4.7×10⁻⁴, Two-way RM-ANOVA), with significant interaction between FactorA (treatment) and FactorB (voltage) (F = 25.9), and by Pairwise Comparisons at −20 mV (*P = 2.08×10⁻⁴, Tukey test). The effect of Aβ on the inactivation time constant was also significant in Tests of Within-Subjects Effects (F = 8.1; #P = 0.04, Two-way RM-ANOVA), and by Pairwise Comparisons at −20 mV, −10 and 0 mV (*P<0.05; Tukey test). (G) Representative I/V curves recorded on DOPC/DOPE BLMs before (black) and after (red) application of Aβ1–42 oligomers. (H) Dose-dependence of Aβ1–42-induced currents at +150 mV across BLMs (mean ± S.E.M., n = 11 experiments, out of a total of 16, in which the effect was observed). HFIP concentrations estimated from 19F NMR spectra of the Aβ1–42 stock solutions are shown on the top axis.

