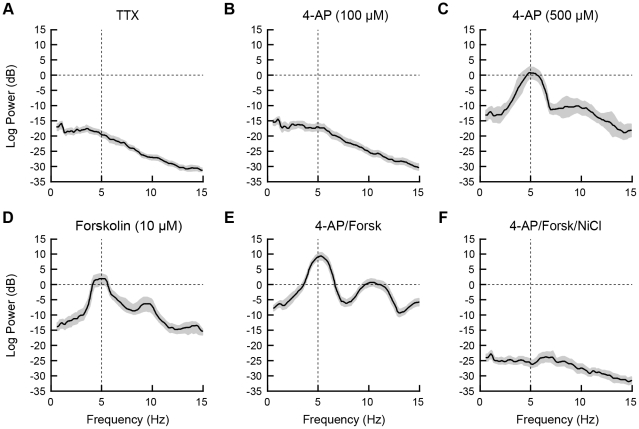
Figure 7. The peak power of the membrane potential oscillation was sensitive to modulation of IA and IT and activation of PKA.
Power spectra of MPOs in BLA PNs in response to a depolarizing step with artificial IPSPs, with mean (solid lines) and 95% confidence intervals (shaded region). Frequencies at which the 95% confidence intervals do not overlap indicate statistically significant differences among the plots. (A) In the presence of TTX, neurons exhibit a weak MPO. (B,C) MPOs were not enhanced by bath application of 100 µM 4-AP (B) but were significantly enhanced by 500 µM 4-AP, with peak power at 4.9 Hz (C). (D) Application of forksolin, an activator of the c-AMP cascade, at 10 µM also enhanced a MPO with peak power at 4.8 Hz. (E) The MPO was significantly enhanced by a combination of 500 µM 4-AP and 10 µM forskolin, with peak power greater than for either drug alone but occurring at a similar frequency. (F) The MPO observed in forskolin and 4-AP was completely abolished by co-application of NiCl (500 µM) to block low-threshold calcium channels.

